overview
problem
research
wireframing
prototyping
testing
results
other

Designing a Smart Interface to Enhance Boater Safety.

Marine Electrification

Marine Onboard Computer - 4 minute read

see results

Role

Product Designer

Product

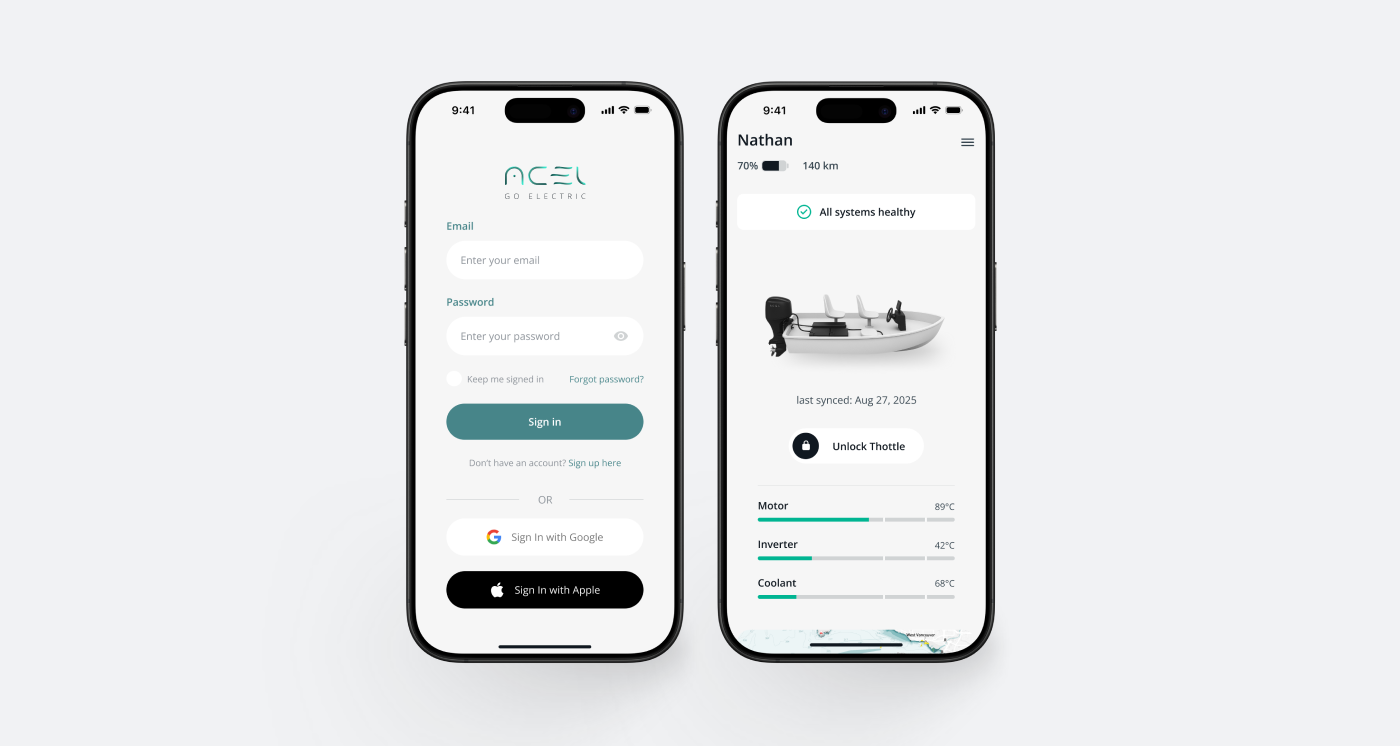
The Marine Onboard Computer delivers real-time data for electric boat owners through an intelligent system of active alerts, live status updates, and an integrated sea map.

Team

David Yan - PM
David Shi - SWE
Ivan Lui - HWE
Harris Das - SWE
Muhammad ur Rehman - SWE

Impact

Designed a human-machine interface dashboard powering marine electric propulsion systems, resulting in 50+ demo requests within 5 months of MVP launch. Achieved a record speed of 41mph (66kmh) for EV boats.

We electrify boats through intelligent electric outboard systems.

The Marine Onboard Computer serves as a core product within the ecosystem, delivering navigation, integrated safety features, and real-time system data to boaters. As the marine industry transitions from gas-powered to electric propulsion, users benefit from reduced operating costs and stronger long-term value. However, this shift introduces new complexities—requiring extensive research, thoughtful system design, and a deep understanding of evolving user expectations.

Problem: Safety

Boaters face range anxiety with electric propulsion systems, resulting in a safety concern.
As traditional dashboards become obsolete in the shift towards digitalization, the absence of real-time visibility results in poor user experiences.

Solution: Integration

Simplify the boating experience in one system.
This reduces user effort and enables faster access to critical data while navigating, reducing cognitive load and requiring fewer decisions. A unified system is clearer, safer, and easier to rely on during emergencies.

This is optional description text
Custom CSS
Thank you! Your submission has been received!
Oops! Something went wrong while submitting the form.

Goal: Develop a Minimum Viable Product within 5 months and drive revenue by improving the customer experience.

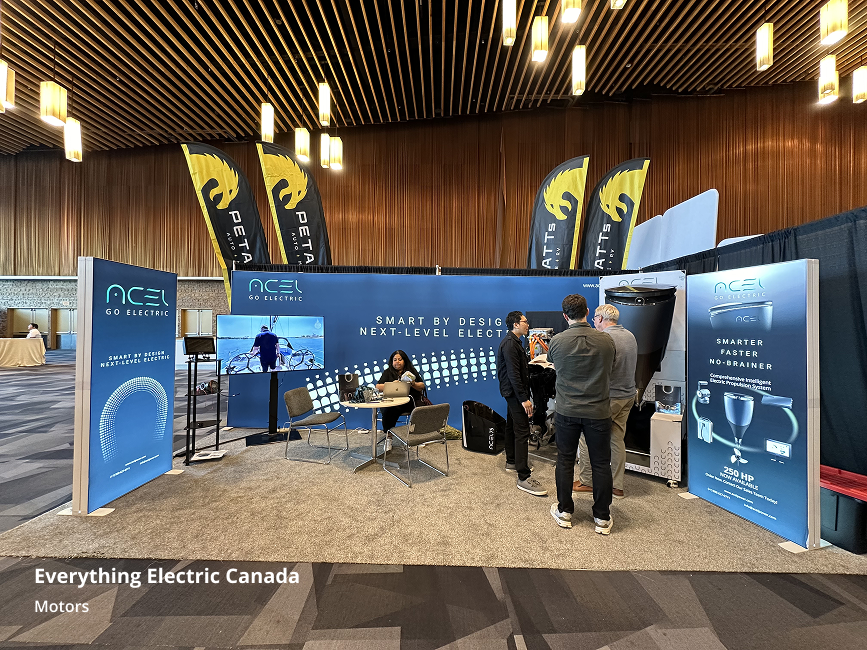
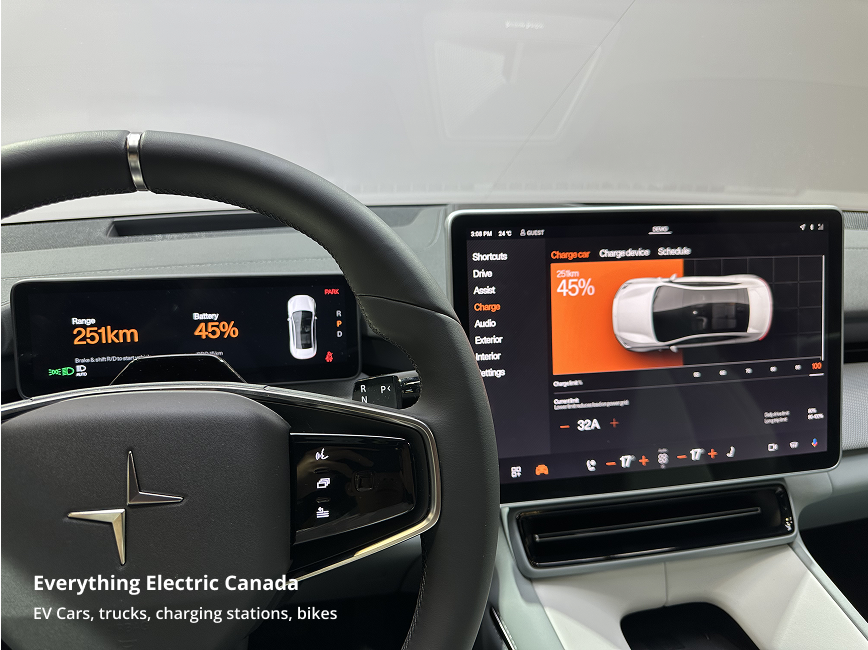
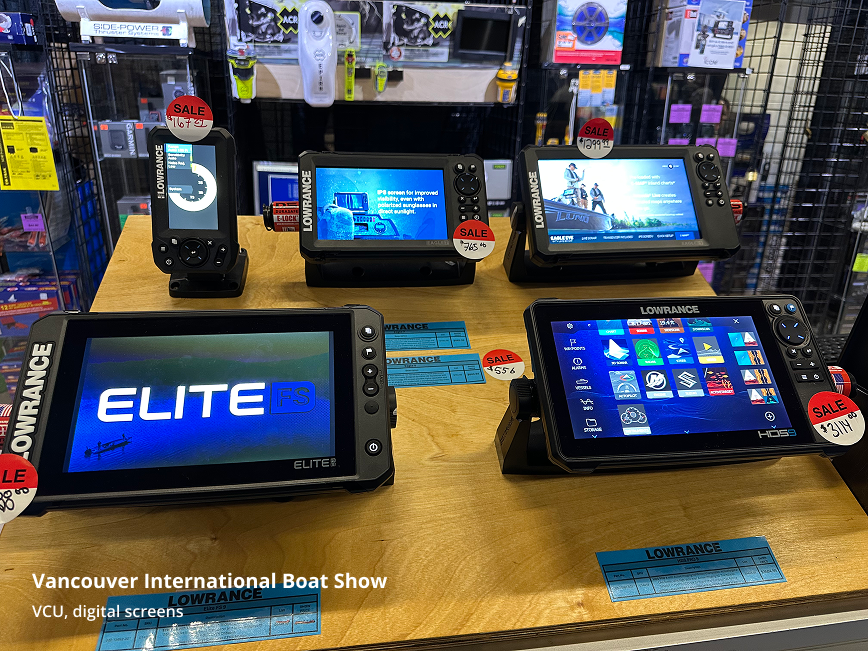
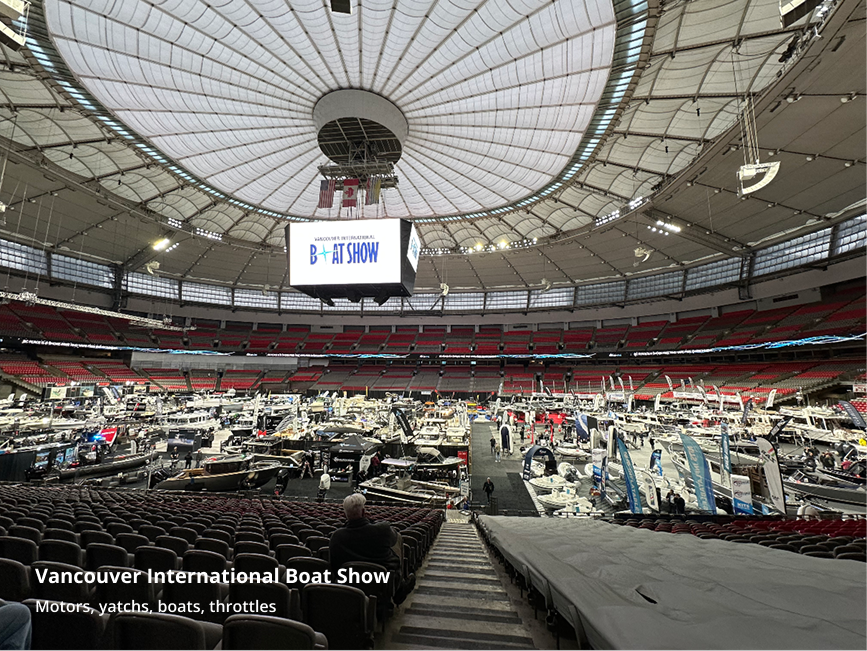
The triple phase timeline allowed us to narrow our scope, which was crucial in a 5 month period to ensure a user-centered approach. To begin, we started with the user and narrowed it down to a specific user group: recreational boaters. Since we were working in a B2B ecosystem, we had the opportunity to speak to existing customers as well, such as boat builders. To better understand the market, we attended trade shows to speak to boaters and to study industry-standard products, informing the development of our own solutions.

Our users were leisure boaters who enjoy day cruising, so we prioritized their needs by analyzing their pain points.

We identified 3 key generations: traditional, growth, and emerging boaters. Each generation had a unique perspective on electric propulsion. Through in-depth user interviews, we built empathy with these boaters to better understand how our product could enhance their electric boating experience.

This is optional description text
Thank you! Your submission has been received!
Oops! Something went wrong while submitting the form.

Safety was a significant problem based on our users.

Common questions emerged during our research: "How long can the boat operate at full throttle? What does maintenance look like? How can I optimize battery performance?" These concerns stemmed from a broader confidence gap—electric boating is not yet mainstream, and many users remain uncertain about reliability and long-term ownership. To address this, we translated these insights into clear user stories, allowing us to step into our users’ shoes and design solutions that directly responded to their hesitations, needs, and expectations.

As a recreational boater, I want to ___ so that ___ .

Next I further organized everything into Figjam into 4 categories — mvp, next version, hardware limitation, and exclude.

Separating insights into categories allowed our team to understand what was within scope. For example, how would this feature benefit our MVP? Are we limited to hardware? Do we keep this for the next version?

Challenge: Design an interface that was clear and legible under real-world marine conditions, such as glare, motion, and moisture.

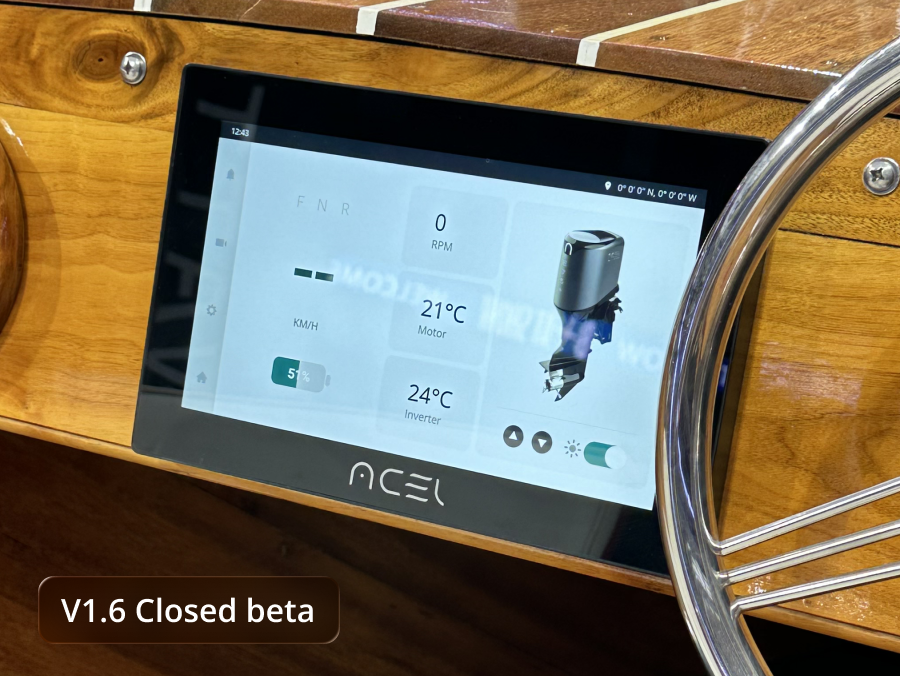
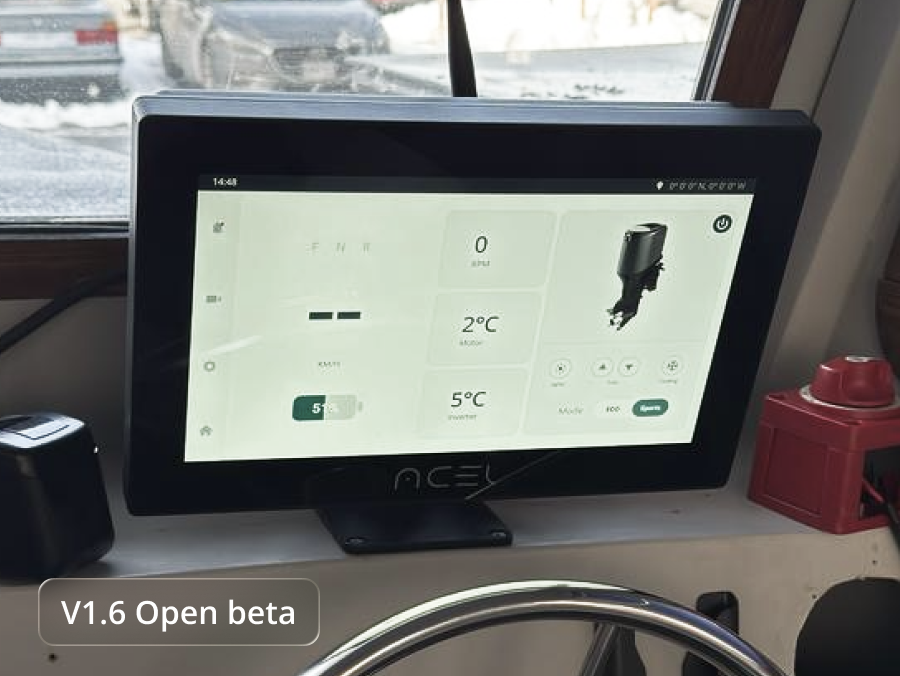
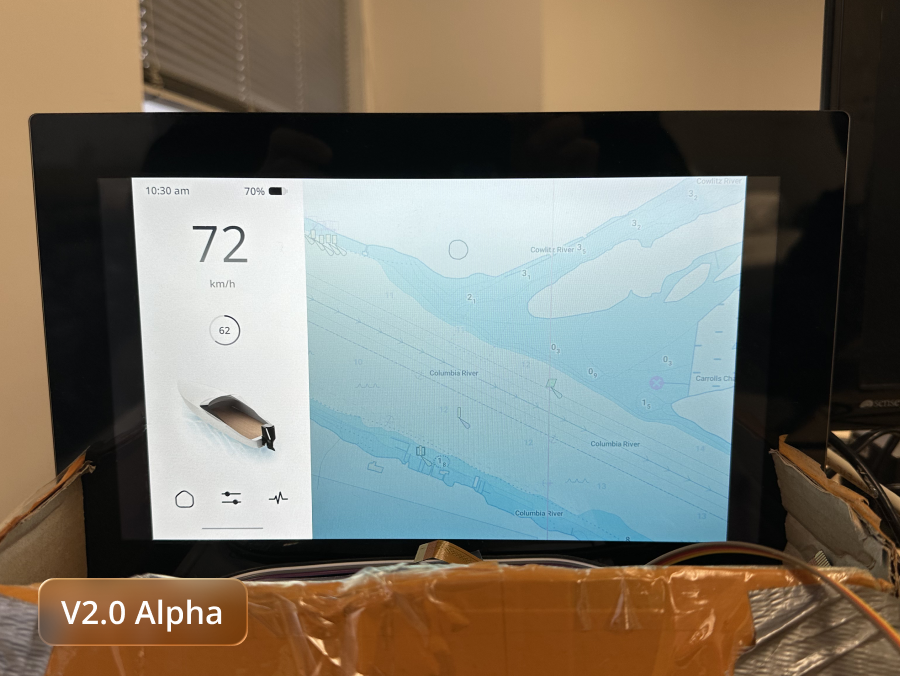
Every element, from typography to color contrast and iconography, was iteratively tested to ensure critical information remained readable at a glance. We also updated older versions of the product, which helped support the newer models.

This is optional description text
Custom CSS
Thank you! Your submission has been received!
Oops! Something went wrong while submitting the form.

Enhancing safety through 4 foundational pillars:

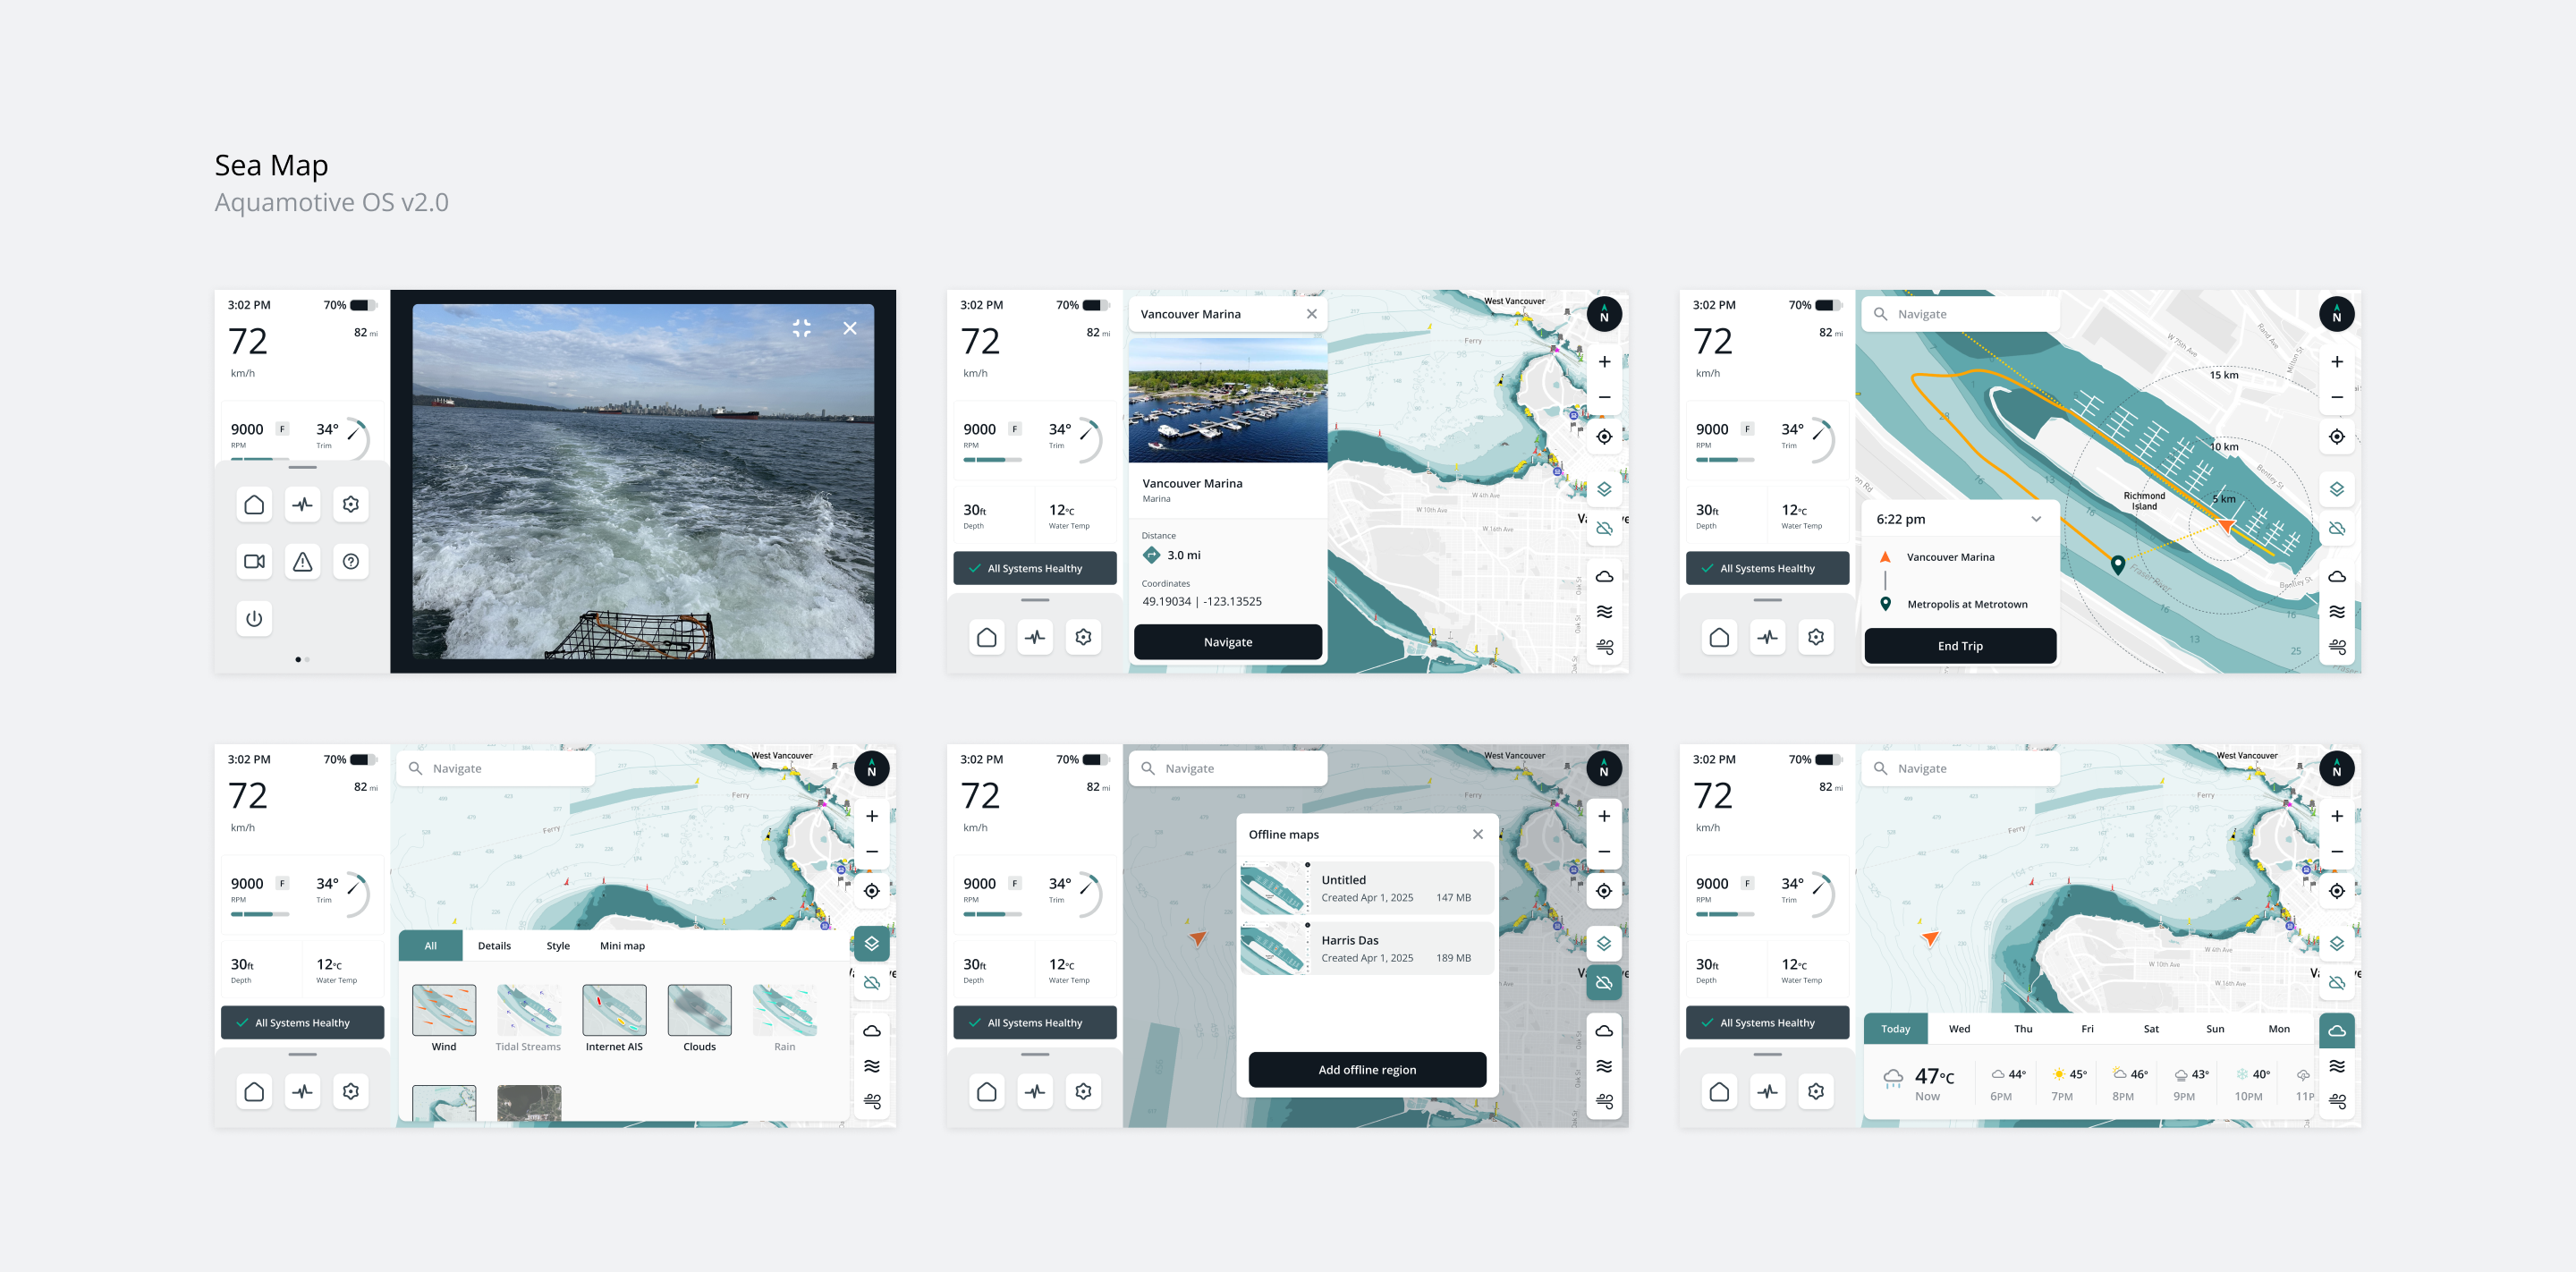
Safety is enhanced through 4 pillars: essentials, navigation, alarms, and real-time data, delivering critical information at a glance. The design involved range and battery levels,  sea charts to address environmental awareness, real-time warnings for mechanical issues, and continuous visibility into motor performance, battery health, and sea conditions.

Flow 1: Motor Status
As a boater, I want to see live details of my motor RPM and temperature so that I am aware of overheating.
Flow 2: Offline Map
As a boater, I want to see my nautical map at all times so that I always know where I am located.
Flow 3: Alert Details
As a boater, I want to know if there is anything malfunctioning in my current system so that I can take action to fix the issue.

The sea chart generated many ideas, but we chose to keep it within scope.

Part of the challenge is knowing when to set aside great ideas for future versions. The sea chart exploration surfaced a wide range of potential features and enhancements, sparking creativity across the team. However, to maintain focus and deliver a cohesive product, we intentionally prioritized features that aligned with our project scope. This disciplined approach ensured that the final design remained practical, user-centered, and achievable within the project constraints, while leaving room for future iterations.

Sometimes, less is more — not all screens made it to MVP.

We intentionally discontinued certain designs that, while interesting, offered limited value relative to the effort required to implement them. This approach allowed us to focus on high-impact features that directly addressed user needs and improved the overall experience.

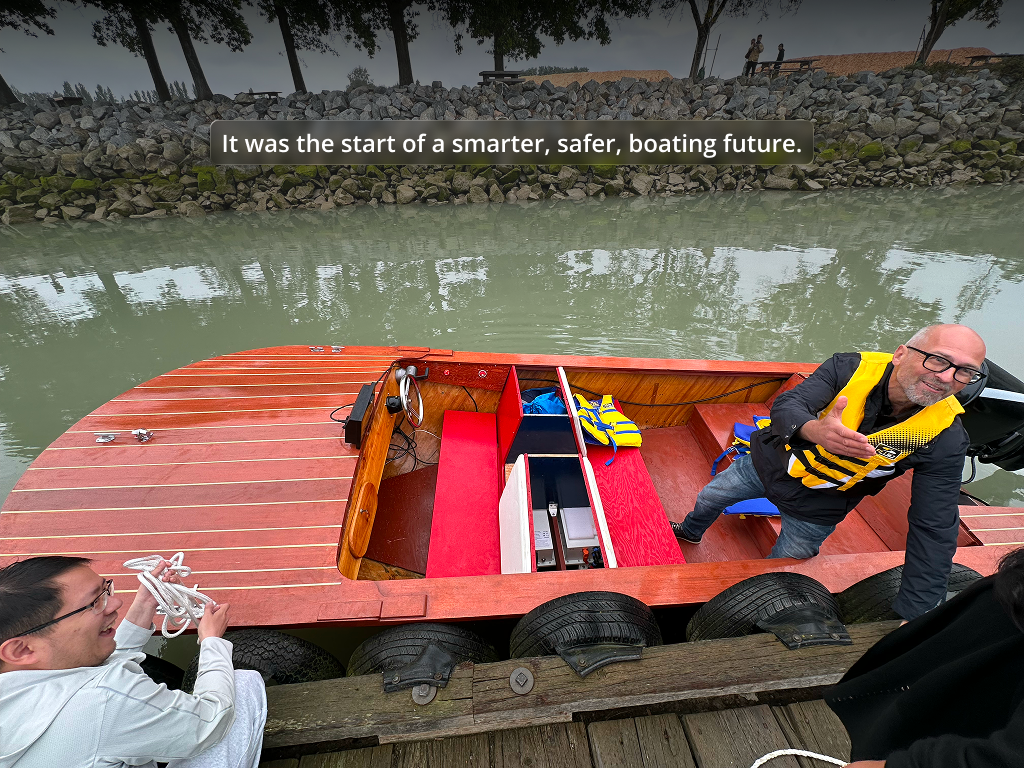
Sea trials was our test environment.  

We evaluated the interface’s legibility and functionality through “seal trials,” simulating real-world marine conditions to test performance under motion, glare, and varying lighting. These trials provided critical insights into how boaters interacted with the system, revealing areas where information could be clearer or controls more intuitive. By observing users in this realistic environment, we were able to refine the interface, ensuring it remained readable, reliable, and easy to navigate in actual boating scenarios.

Range anxiety was a problem, so we delievered a safety mechanism to restore user confidence.

The value of this product ultimately brings safety, user awareness, and control. Thanks to the product, our users were able to hit 41 mph (66 km/h) on leisure boats, without second-guessing safety. Although this project was challenging and fast-paced, I believe it pushed me to think beyond screens by considering environmental and user context. I learned that being a great designer means creating solutions that perform effectively in real-world scenarios.

It doesn't stop there - What if boaters want to remotely monitor their propulsion system?

We explored how users could check battery levels, receive performance alerts, and track system health with the Onboard Computer. By enabling remote monitoring, the next cast study explores how boaters can feel more confident and in control, even when away from the water. This forward-thinking approach opened opportunities for smarter, connected interactions that enhance safety, efficiency, and overall trust in electric boating.

next project